Right panel tabs
The right panel of the AICA application editor is an interactive window into configuring and monitoring all aspects of an AICA application. It has different functionality depending on the currently selected elements and the contents or running state of the application. The panel is divided into the following tabs:
Scene
The scene tab contains three sub-tabs for settings, adding components, or listing elements in the scene, and is the main place to manage the contents of the application graph.
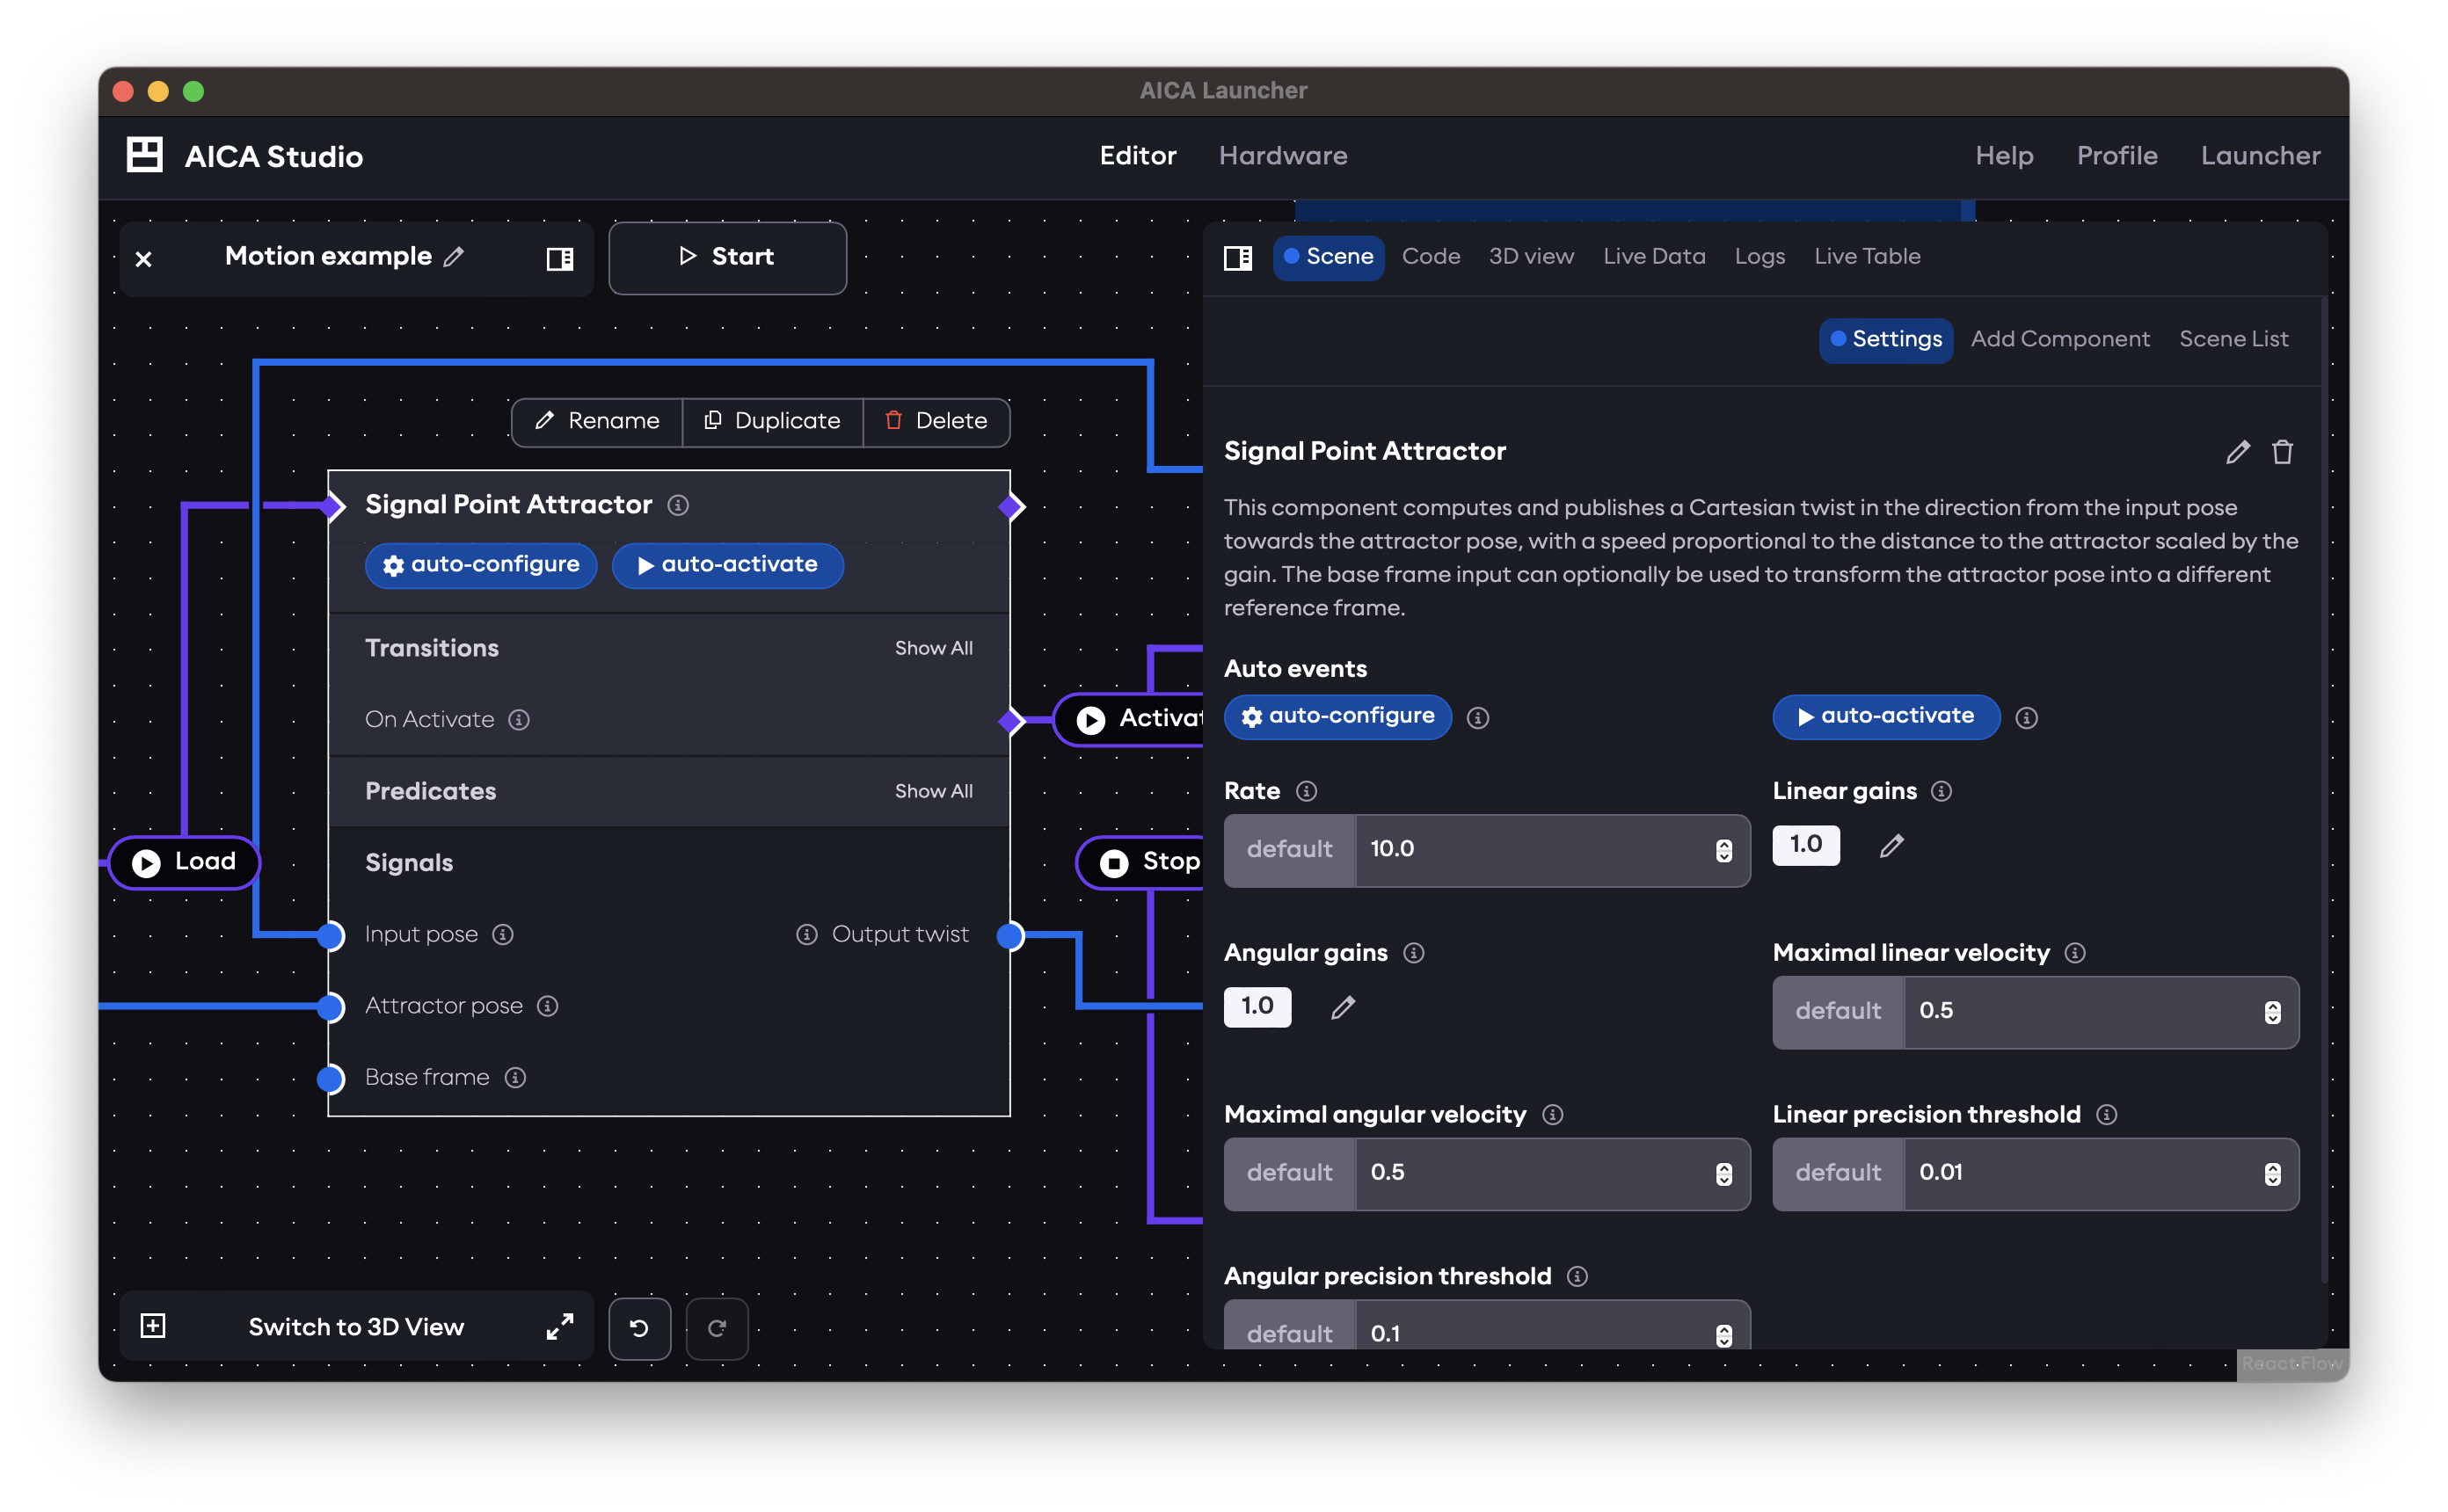
Settings
The settings sub-tab is context-aware depending on the selected element in the application graph. It shows relevant properties and information and provides controls to change parameters and behavior of the element.
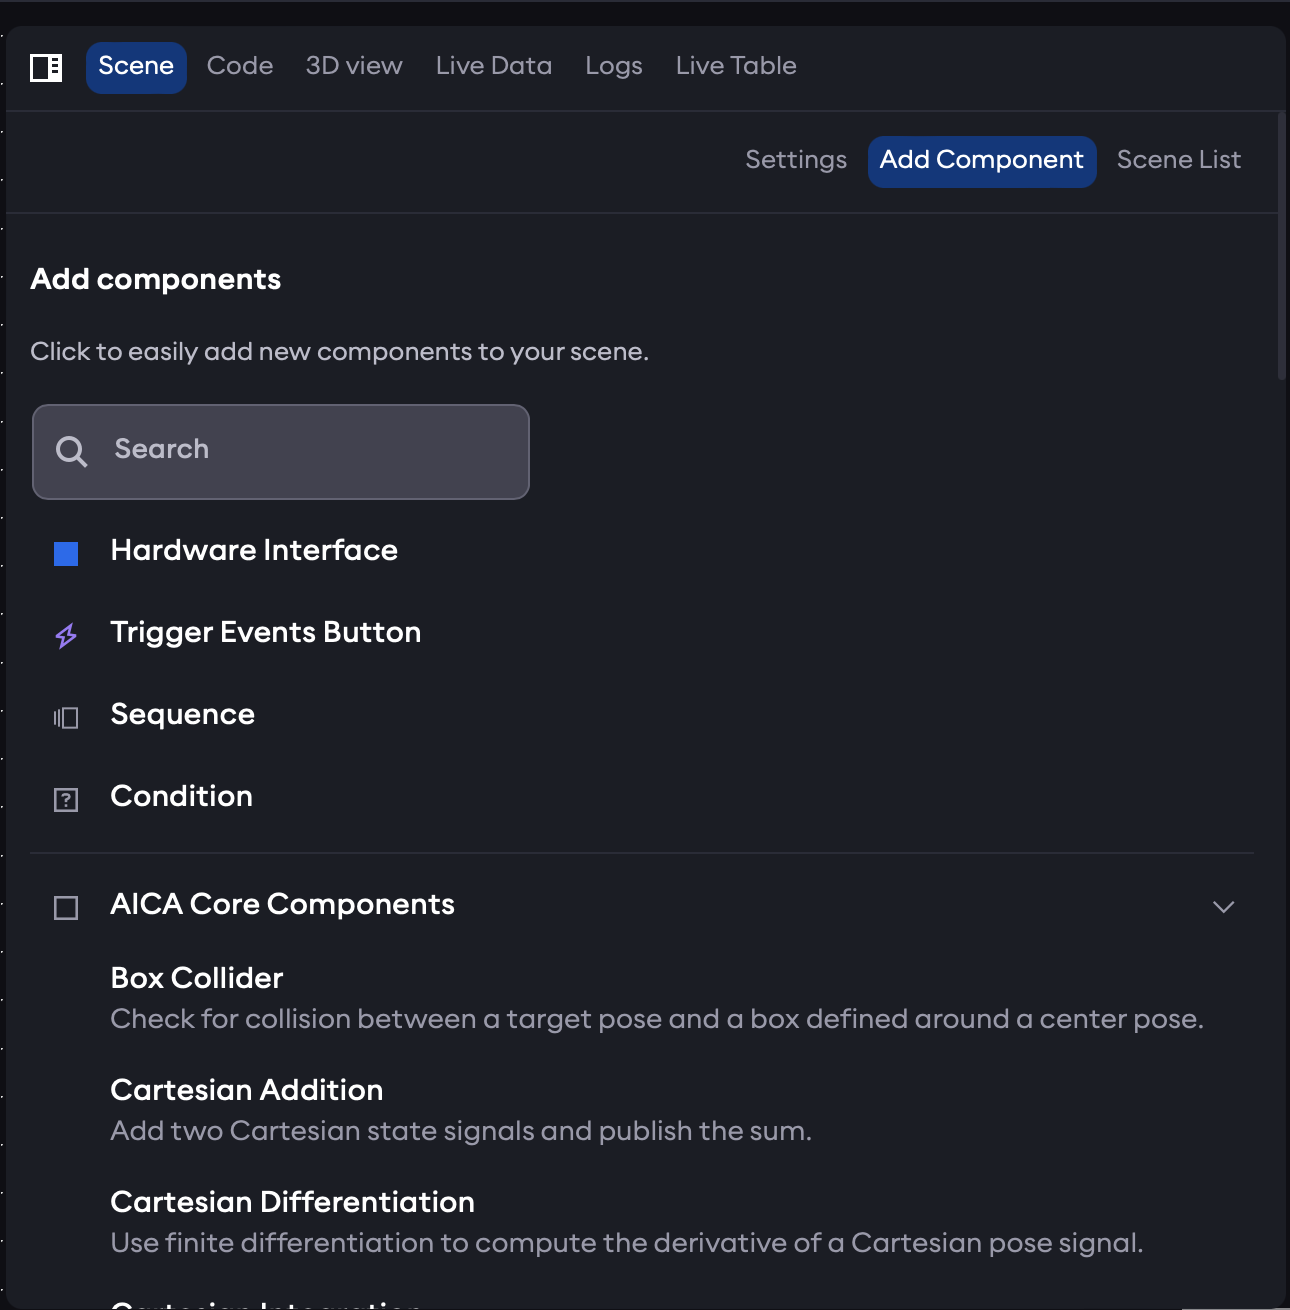
Add Component
The Add Component sub-tab is used to add elements to the application.
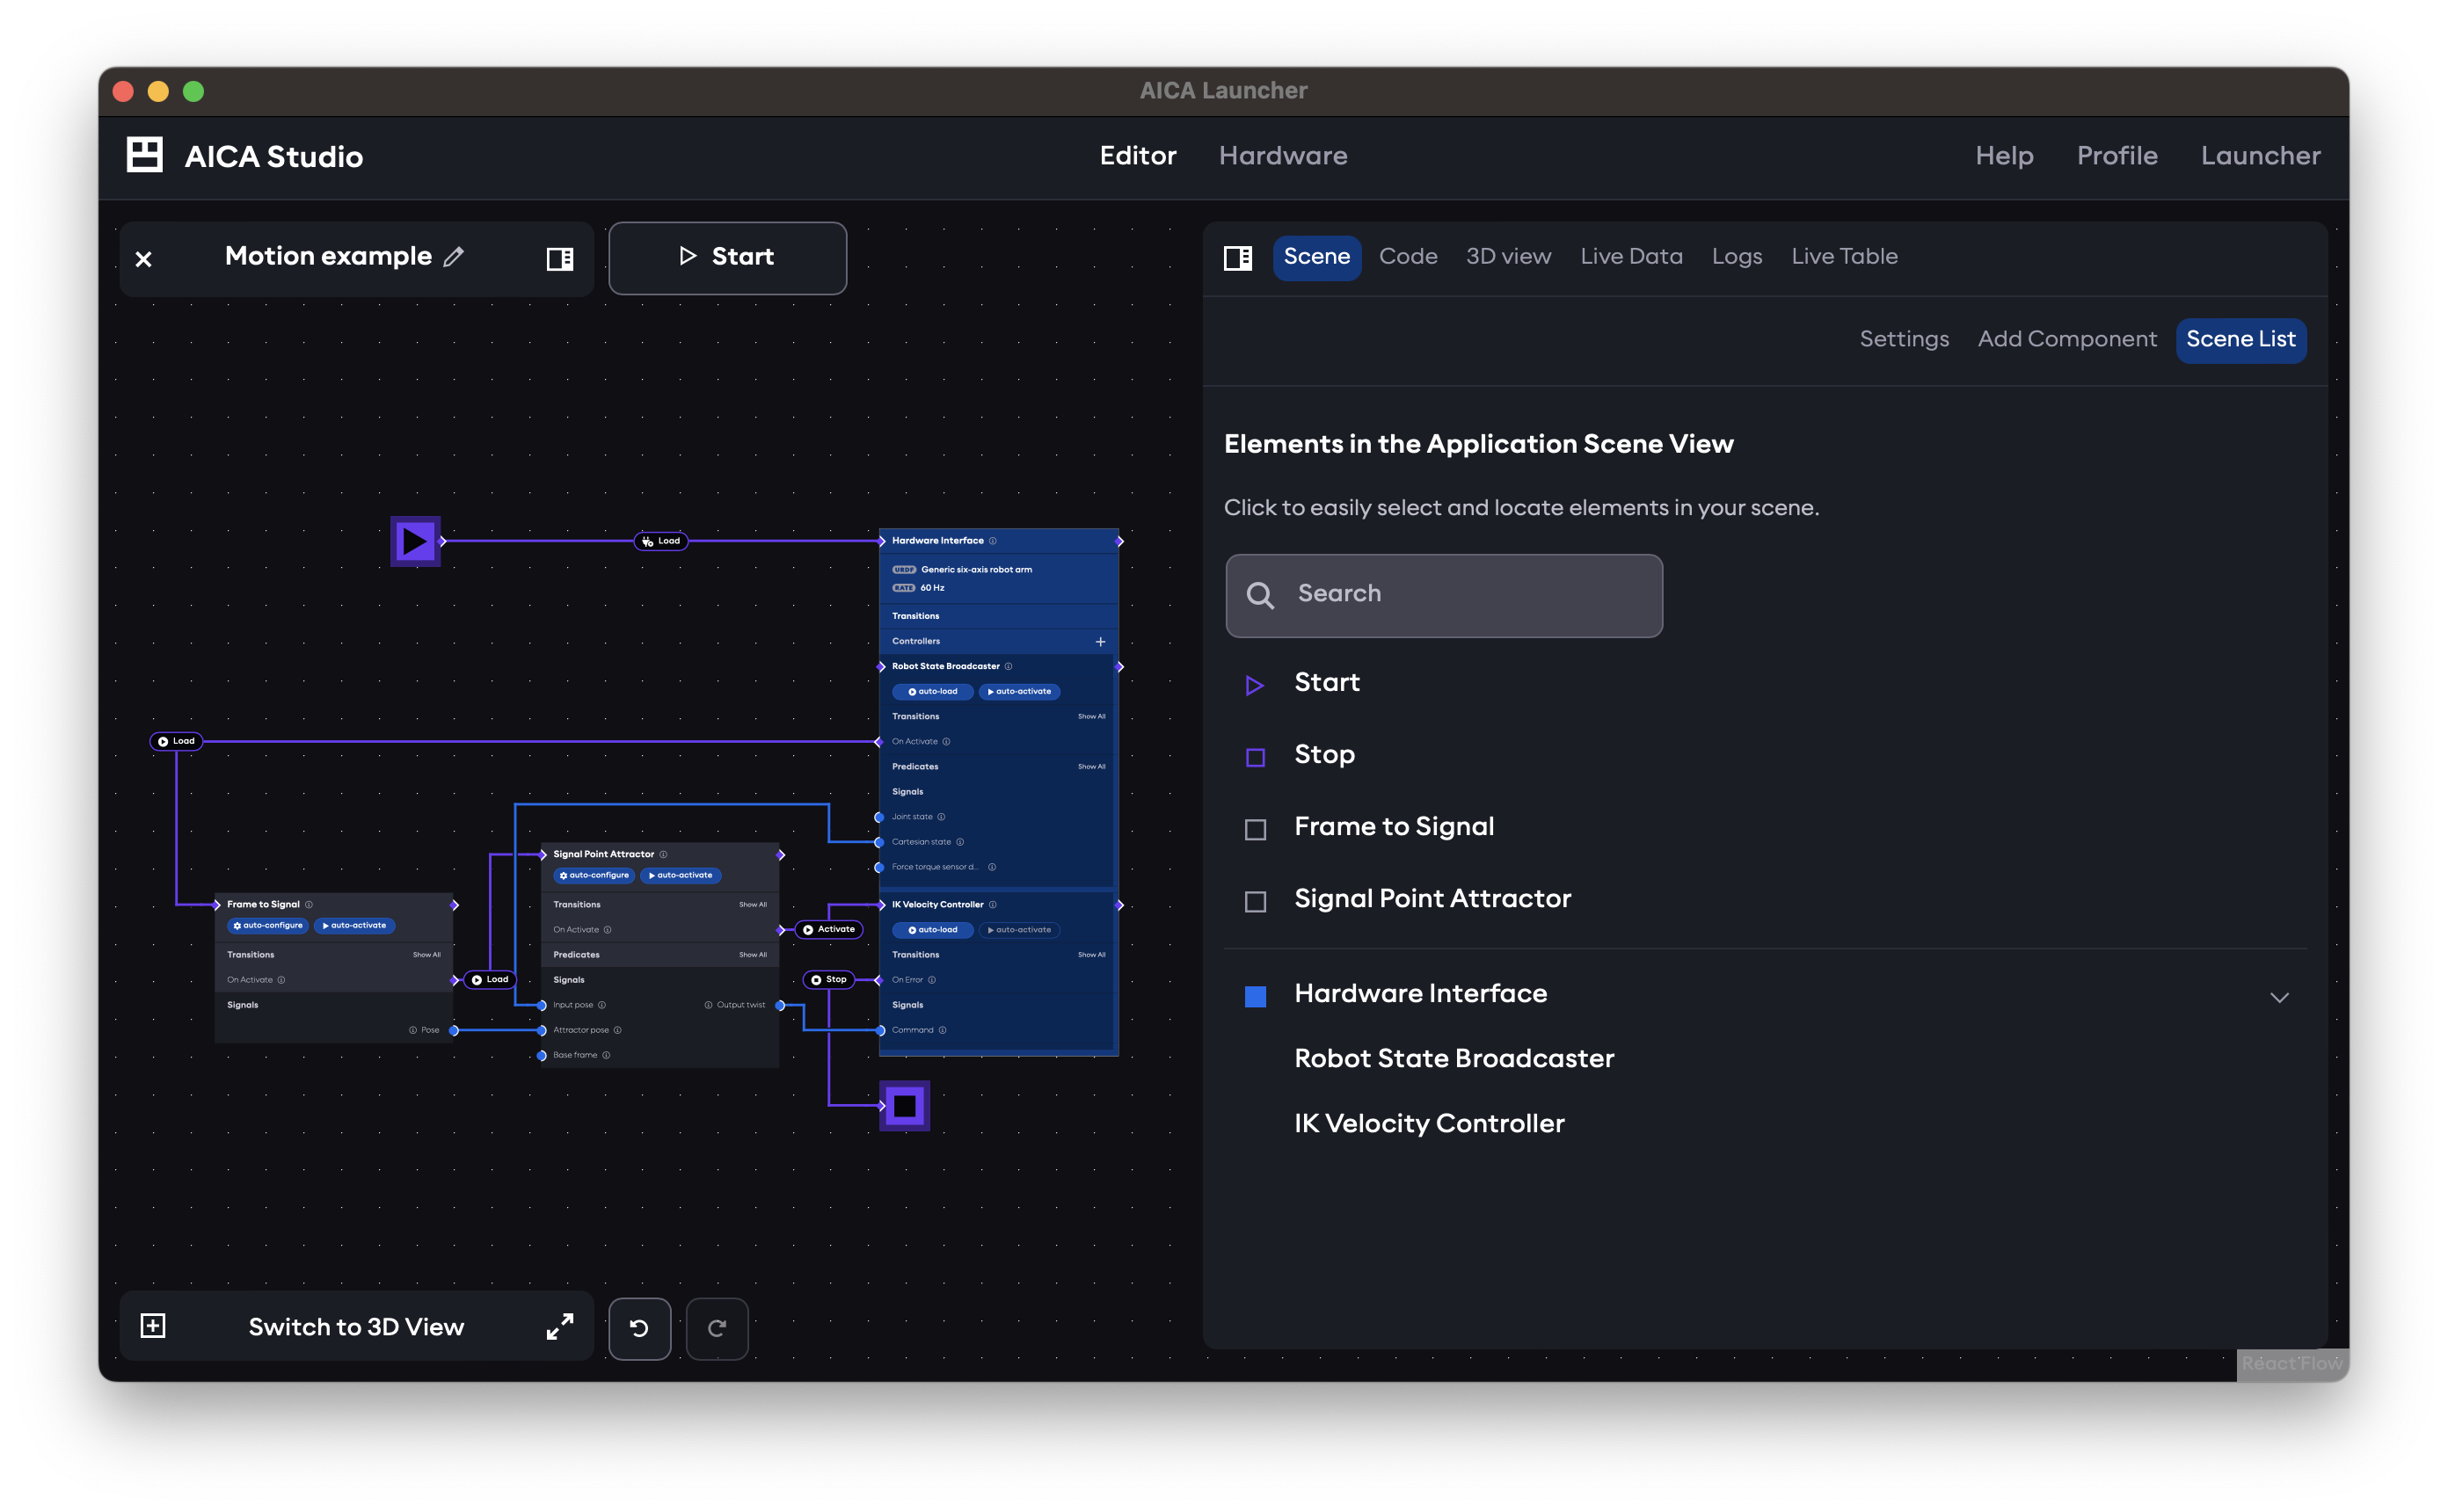
Scene List
The Scene List is a compact display of all elements in the application. Clicking on an element will select it in the application graph, zoom the view to center it, and show its settings in the Settings sub-tab.
Code
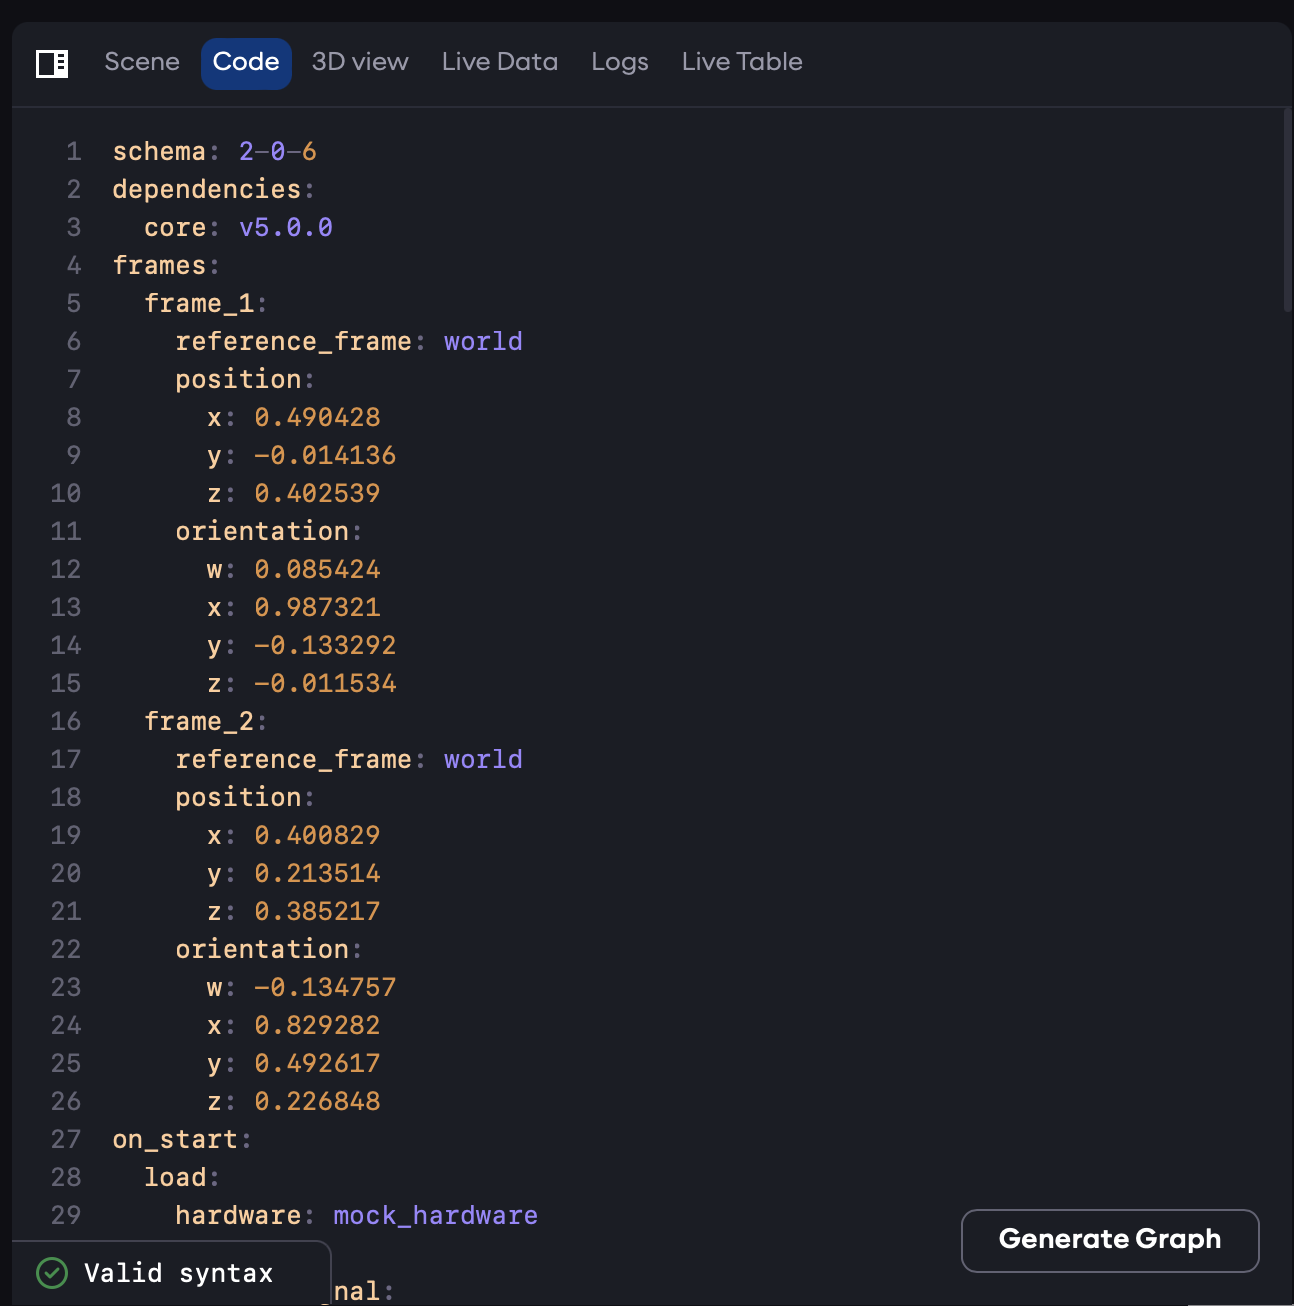
The Code view shows the YAML code representation of the AICA application. This code is automatically regenerated whenever any edits are made to the application graph or to elements in the 3D scene. It is possible to change the YAML directly using the built-in editor. However, changes will not take effect until the "Generate Graph" button is pressed. In case of syntax errors, graph generation will fail and the relevant error messages will be displayed in the Code view.
3D view / Graph view
Depending on whether the main view shows the application graph or the 3D view, this tab will provide the alternate view. The right panel mode of the graph view is non-interactive for modifying nodes, edges, or parameters but allows zooming, panning, and pressing trigger buttons for configured events. When the 3D view is in the right panel, the 3D view settings are accessed from a mini-panel rather than the Settings sub-tab of the Scene tab.
Live Data
While an application is running, view the data flowing on signals and other background topics on the ROS 2 network. Use the Choose Topic selector to change the topic to visualize. Selecting a signal edge in the graph view while the application is running will automatically select the appropriate signal topic for visualization in this tab.
For certain signal types, in particular related to Cartesian or joint states, individual state variables can be selected for visualization. The signal viewer can also be zoomed and scrolled to focus different time or value ranges.
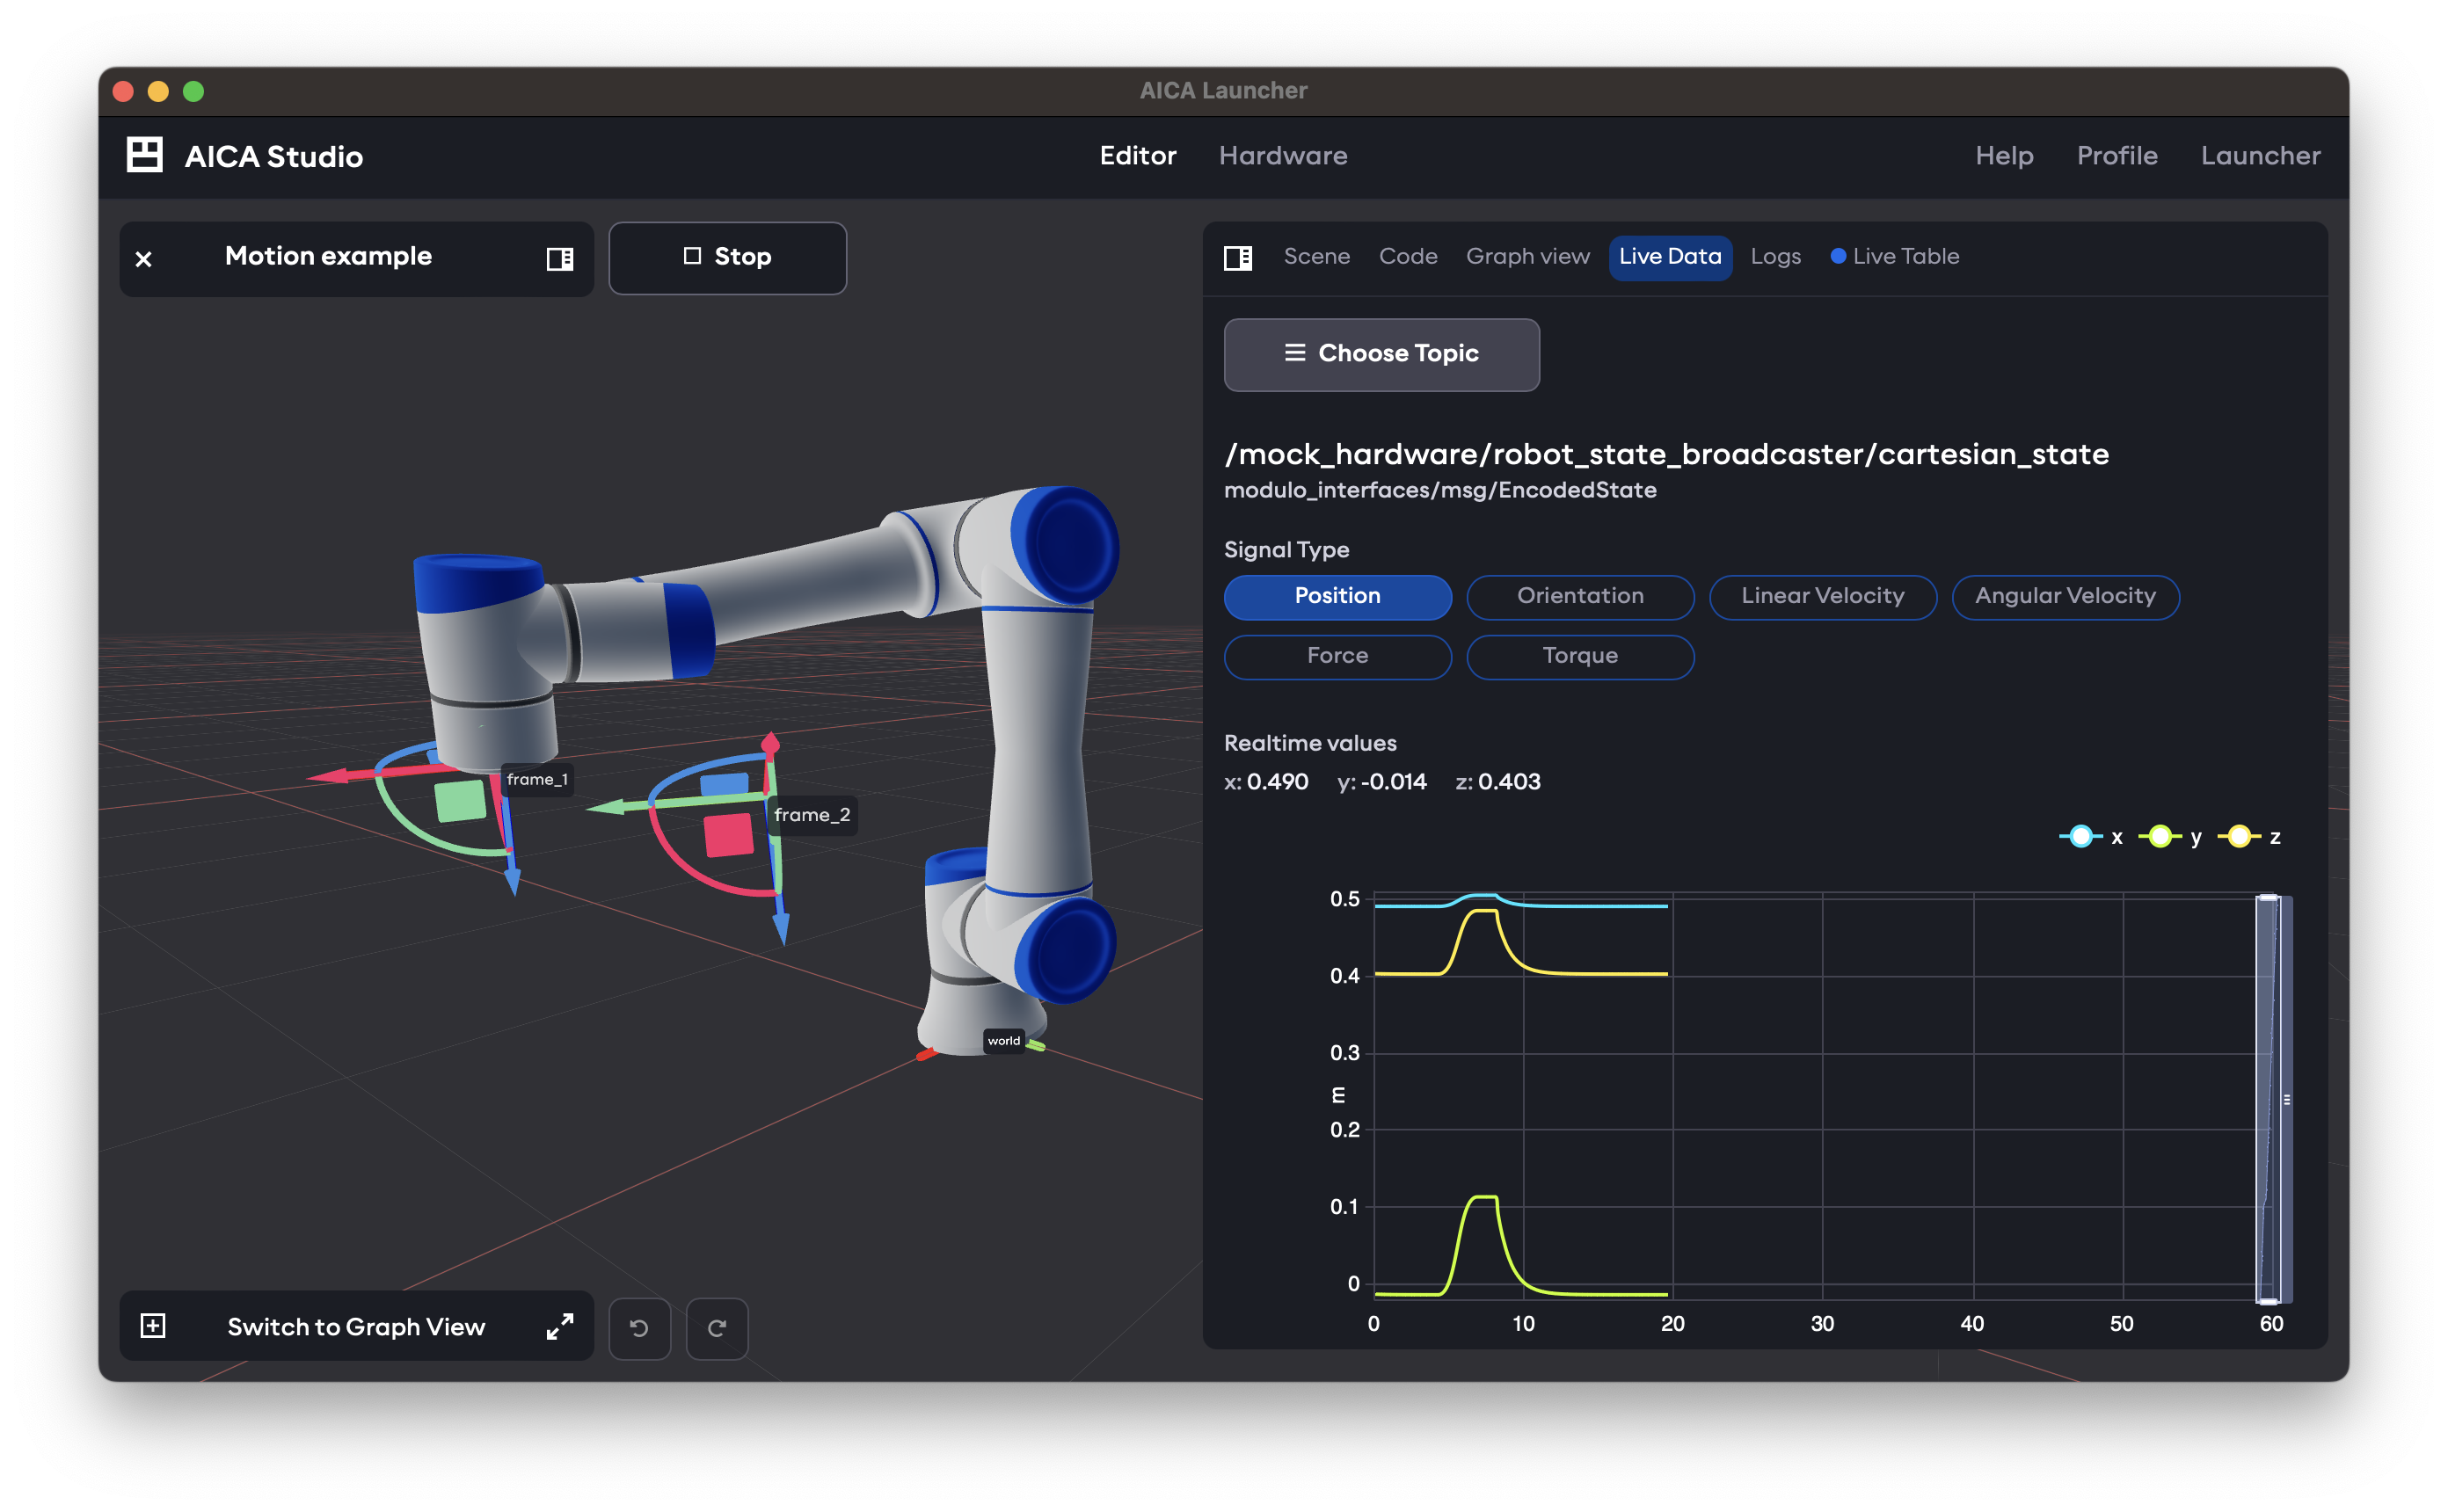
Image messages are not yet supported, but are planned for an upcoming release.
Logs
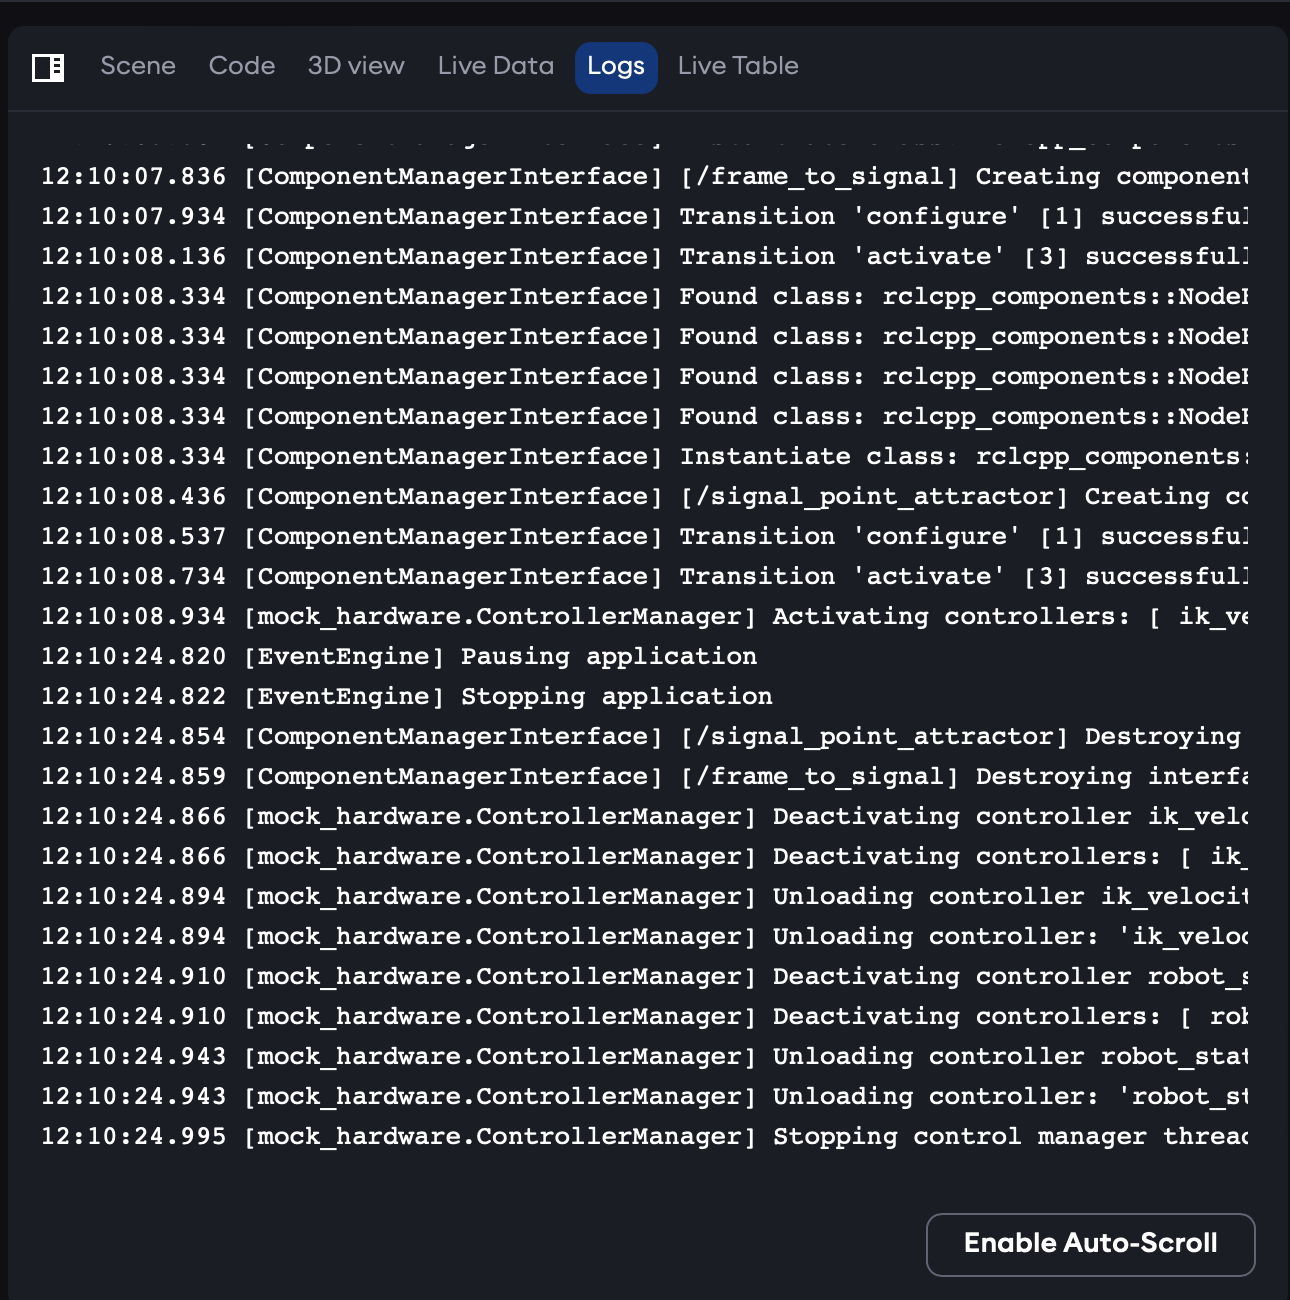
The logs view shows log entries from the running system color-coded by severity level. The auto-scroll option automatically scrolls the view to the bottom whenever new log entries are added. Scrolling up in the log view allows accessing previous log entries and temporarily disables auto-scroll.
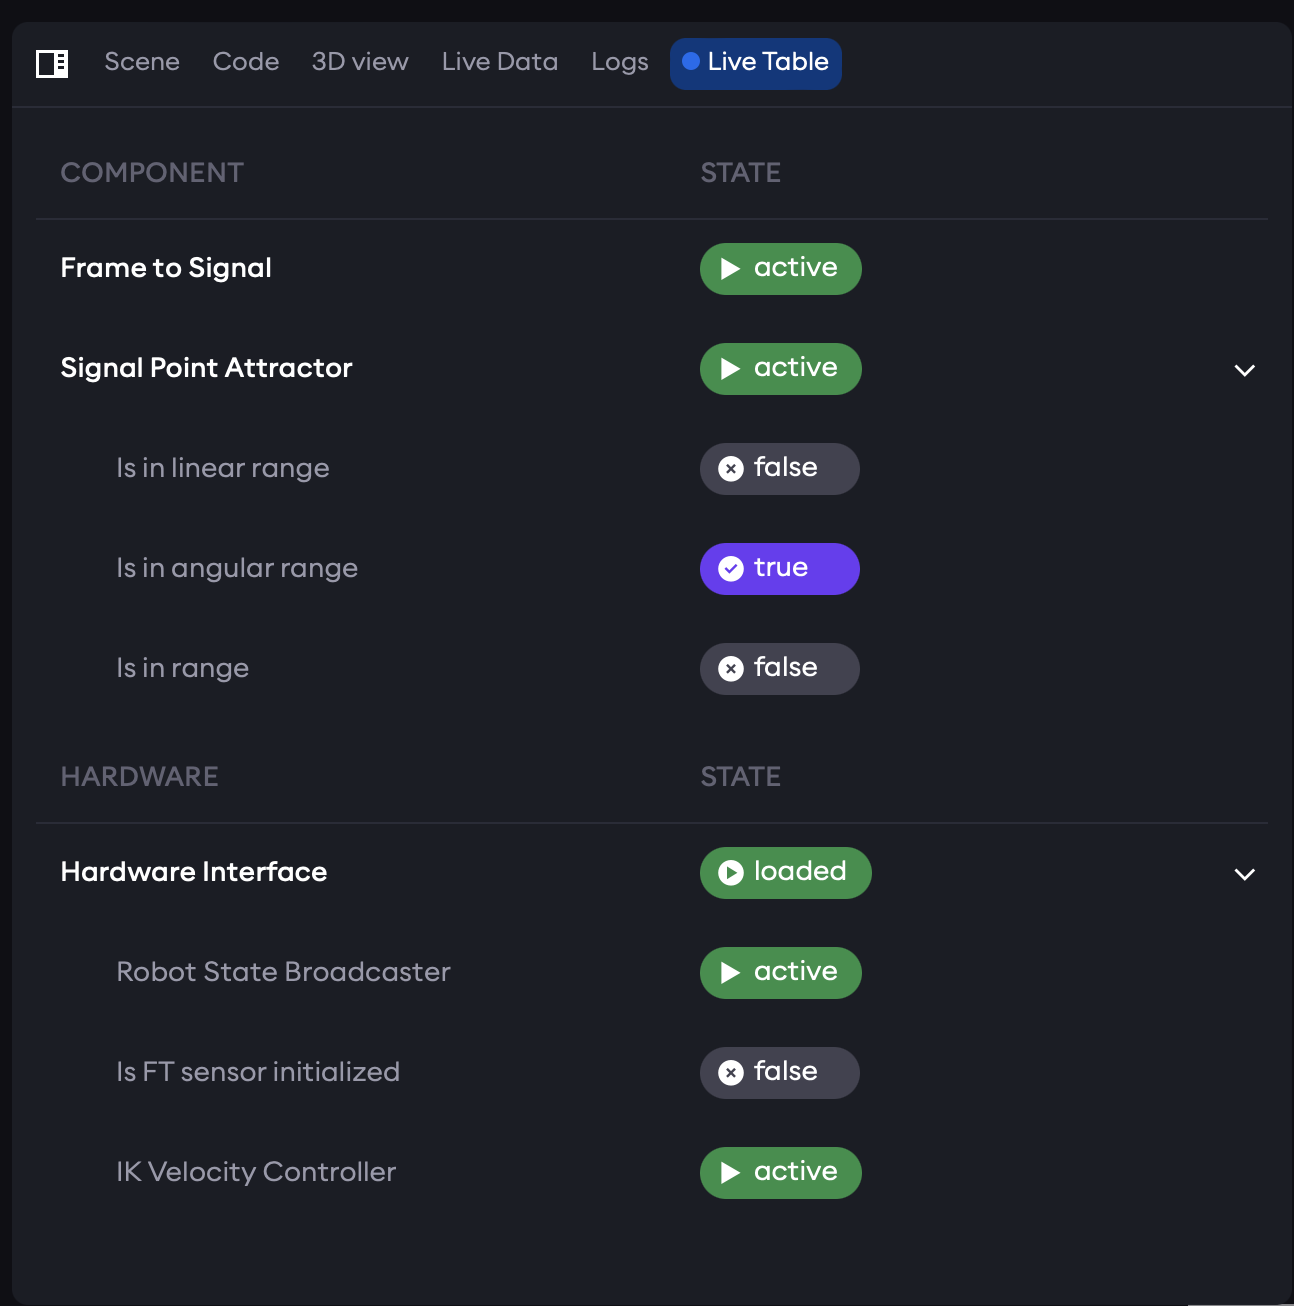
Live Table
When the application is running, the live state table gives a compact overview of which components and controllers are loaded, what state they are in, and which predicates and conditions are true or false.